Stripping away the mystique of complex data, translating it into a format that is easy to use and understand.
Unrivalled data on 60,000+ schools and nurseries, incl. all state & independent primary and secondary schools.
We are undeniably the largest and most comprehensive single source of school and local area information in the UK.
Below is a short video tour, which highlights the key features available on the site.
With our easy to use, intuitive map you can locate and browse any area at different zoom levels and see at a glance where schools are located.
Schools have different icons depending upon their type. So, you can see easily if a school is nursery, primary or secondary.
Icons are coloured according to their inspection rating. So, it is obvious which schools are outstanding, good, requires improvement or inadequate. England and Wales only. Estyn reports are used for Welsh schools.
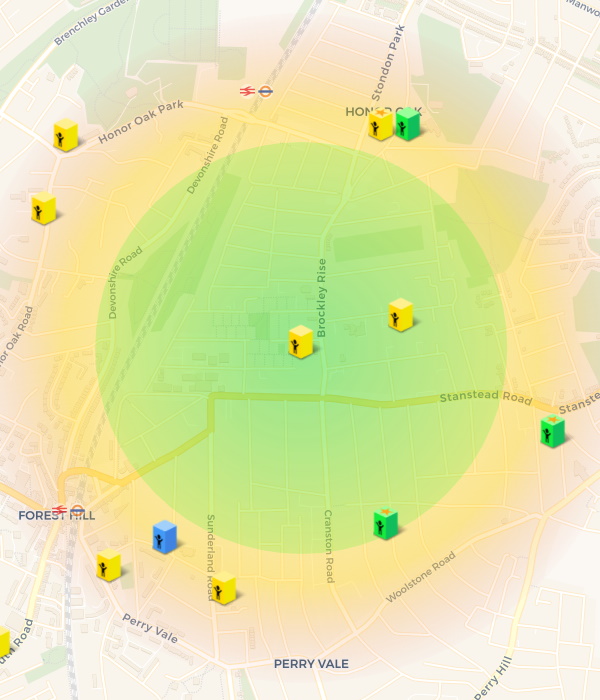
Clicking on a school shows a catchment area indicator, which provides a guide as to where you might need to live to get into the school.
Our super advanced catchment area checker shows at a glance where the latest intake of pupils live, however it also allows sophisticated analysis of the data.
The criteria in which schools use to allocate places in the event that they are oversubscribed can and do vary between schools and over time. These criteria can include distance from the school and sometimes specific catchment areas but can also include, amongst others, priority for siblings, children of a particular faith or specific feeder schools. Living in an area where children have previously attended a school does not guarantee admission to the school in future years. Always check with the school’s own admission authority for the current admission arrangements.
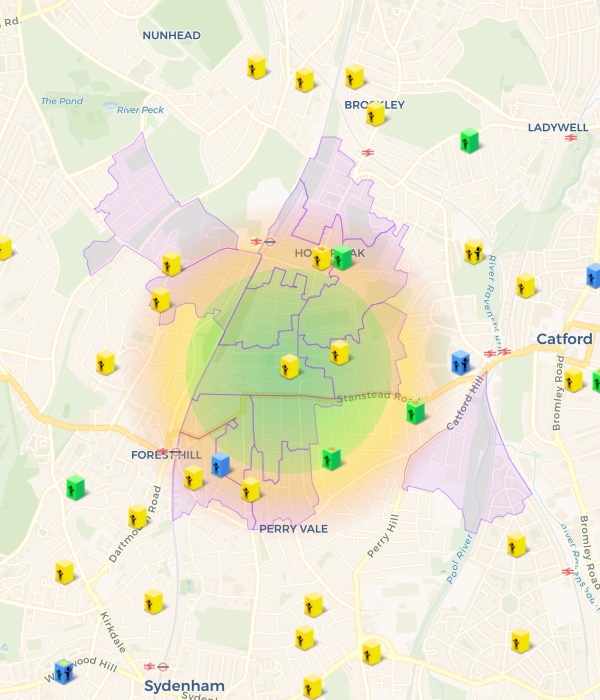
See down to local areas where existing pupils live.
Chose which year groups are included, e.g. show only the latest intake, a selected year group or the whole school.
You can even view data for selected year groups going all the way back to 2014/15.
This work was produced using statistical data from the Office for National Statistics. The use of the ONS statistical data in this work does not imply the endorsement of the ONS in relation to the interpretation or analysis of the statistical data. This work uses research datasets which may not exactly reproduce National Statistics aggregates.
We have collected last distance offered data from local authorities, which are plotted on the map along with our catchment indicators. We link to the documents that contain the data, as well as any other useful websites, such as those showing priority areas. England only; not available for all schools.
We've analysed pupil's moves between primary and secondary schools, so you can easily see how pupils transition between schools, e.g. to which secondary schools pupils progress to, or which primary schools pupils have come from.
See not only which schools pupils have moved to when clicking on a primary school, but also which schools pupils have come from when clicking on a secondary school.
Discover the percentage of pupils from each primary school that go on to attend a grammar school.
With our sixth-form analysis you can see how many pupils remain at a school for sixth-form and, for those that don't, which schools they move to or have come from.
We've analysed which primary and secondary schools pupils in each neighbourhood attend. This unique feature provides valuable insight into neighbourhoods, which is not available anywhere else.
Find an area of interest by adding a "Home Location" marker to the map or by using the "Show where existing pupils live" feature for schools.
Discover the percentage of local pupils that attend a grammar school.
Get answers to questions like: Will there be other local children attending the same school as my children? If I live here, which schools are my children likely to attend? Are there any schools I've not considered?
See the distribution of current pupils at the school, with shading to indicate the relative number of pupils in each area. This feature allows you to get a feel for where pupils at the school tend to live.
The criteria in which schools use to allocate places in the event that they are oversubscribed can and do vary between schools and over time. These criteria can include distance from the school and sometimes specific catchment areas but can also include, amongst others, priority for siblings, children of a particular faith or specific feeder schools. Living in an area where children have previously attended a school does not guarantee admission to the school in future years. Always check with the school’s own admission authority for the current admission arrangements.
To view this information you should turn on "show where existing pupils live" and select "whole school" in the year group filter, before clicking on the school you are interested in.
This work was produced using statistical data from the Office for National Statistics. The use of the ONS statistical data in this work does not imply the endorsement of the ONS in relation to the interpretation or analysis of the statistical data. This work uses research datasets which may not exactly reproduce National Statistics aggregates.
View detailed school admissions data, including the number of applications and offers made for all state schools in England, sourced directly from individual local education authorities. Even including which preference the school was given on the Common Application Form (CAF).
We use this data to indicate if a school is oversubscribed or not; where we consider a school to be oversubscribed if not all children who put it as their first choice school were offered a place.
We uniquely use the definition above, devised in conjunction with the DfE. It's a more considered definition than simply comparing total applications vs total offers, which would make more schools appear oversubscribed than they actually are, based on preferences.
Create a league table of local schools using our slide out sorted list, which allows you to sort all the schools currently visible on the map by a range of metrics, from popularity to pupil progress.
Sort schools by a range of items; such as name, inspection rating, Key Stage 2 performance, GCSE performance, A-Level performance, value added (progress) scores, number of pupils per teacher and even school fees for Independent schools.
Zoom in and out or scroll around to change the schools included in the local school league table.
You can add/remove schools to/from your shortlist via the list; shortlisted schools are highlighted with a heart.
We have collected a range of useful and interesting information about local neighbourhoods, from sources such as Ofcom, HM Land Registry and the Ministry of Housing, Communities and Local Government.
Discover local broadband availability and recorded speeds.
Discover average property sold prices and historical price trends.
Discover a wide array of socio-economic information covering:
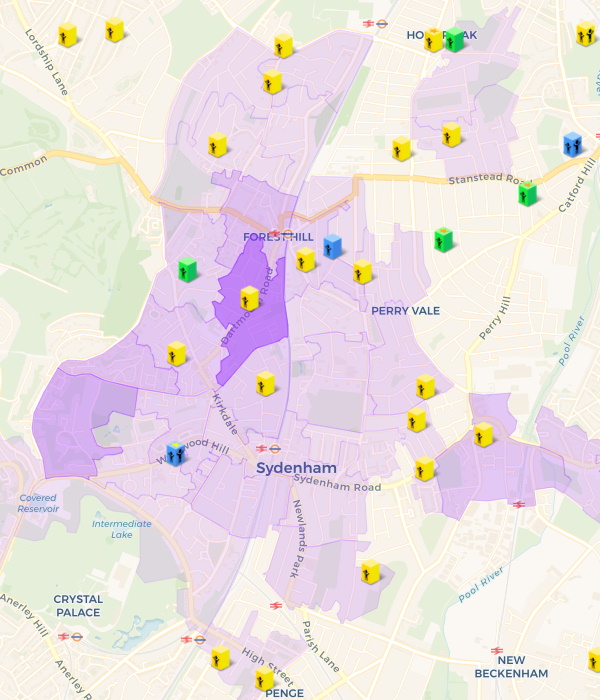
Our socio-economic layers use the socio-economic data available via our neighbourhood profiles to highlight different socio-economic metrics on the map by neighbourhood. Available metrics that can be viewed include income, crime, health, environment, education and more. The summary layer combines all these measures to highligh each neighbourhood's overall socio-economic ranking; where colours range from red areas, which have a low socio-economic ranking (i.e. high overall deprivation) to green areas, which have high a socio-economic ranking (i.e. low overall deprivation).
Discover the socio-economic ranking of neighbourhoods. The overall ranking is calculated by considering all of the below:
Each of the metrics listed above can be viewed in its own layer, e.g. you can view just the relative crime levels between neighbourhoods, or relative income etc.
We've built a link to the national police database that allows us to show all the reported crimes in the UK on our map. Crimes fall into one of 14 different categories, ranging from shoplifting to violence and sexual offences.
View the locations of every crime recorded.
Filter the crimes displayed by the type of crime, e.g. burglary, bicycle theft etc.
Filter the crimes shown by time period, e.g. show only those from the last 6 months.
Discover more about an area by turning on our points of interest. We have almost half a million points of interest across the UK, including supermarkets, pubs, bars, cafes, restaurants, parks, gardens, playgrounds, swimming pools, sport centres, museums, galleries and much more...
Easily show or hide categories of interest (such as Food & Drink, Attractions, Leisure, Supermarkets etc.) using the map filters.
Our handy pre-constructed Google searches allow you to quickly find out information about a point of interest using Google.
Local points of interest data has been collated from numerous sources, including open source databases maintained by the general public. Some of this data therefore is not as 'official' as the other data on our site, which is all sourced from official sources.
Using our school filters, you can easily select which schools are displayed on the map, to help narrow down your search.
You can filter by the age range and gender of pupils.
You can filter schools by their Ofsted rating and also by the exam performance of their pupils relative to other schools on the map; e.g. show only the top 5 performing schools in the visible area.
You can also filter schools based on other criteria such as their religion, whether they are primary schools, secondary schools, grammar schools, boarding schools, special schools etc. Independent schools can be switched on or off.
The level of data shown on Locrating is truely unparalleled. Clicking on a school allows you to view a host of information; including all a school's inspections, exam results, parents' opinions, application and offer details, whether it is oversubscribed, which schools children go on to and have come from and more. You won't find this level of information anywhere else. Some data is England only.
A useful summary tab shows key information about each school, such as the number of pupils, gender, pupils per teacher, % free school meals, % English not first language etc. Along with at-a-glance-indicators which show the performance of the school based on the exams taken by its pupils.
In the inspections tab, we show the headline items from each school's latest Ofsted report (or Estyn report for Wales) including its summary findings, so you don't have to open and read the individual reports for each school.
See school reviews taken directly from the only official source of parent's opinions: Ofsted Parent View, which is used by Ofsted when making decisions about which schools to inspect and when. Ofsted Parent View gives parents the chance to tell Ofsted what they think about their child’s school, from the quality of teaching to dealing with bullying and poor behaviour.
Our exam results tabs show current and historical exam results, including all the latest measures, such as Department for Education progress measures; designed to allow the comparison of pupils' progress and attainment across different schools. We also show independent school GCSE results, which are not available from the government's own exam results site.
Compare results for schools at Key Stage 2 (Primary), Key Stage 4 (GCSE) and Key Stage 5 (A-Level). Links to the DfE website allow you to further drill down into results. Limited exam data is available for school in Wales, Scotland and Northern Ireland.
Previous years' results are also displayed so you can make a year-on-year comparison.
Handy videos explain the various different measures that can be used to compare schools and how they work.
Discover which GSCE and A-Level subjects pupils at each school have studied, including the number of pupils that sat each exam. This provides valuable insight into the varierty of subjects on offer at schools and also some insight into potential class sizes; especially at A-Level.
View GCSE and A-Level subjects on offer at state and independent schools.
Only includes qualifications that count towards the government's performance tables; IGCSEs, for example, which a lot of independent school pupils sit are not included.
We show the number of boys and girls in each year group, the average class size and the ethnicity of the pupils in the school.
Find out the average class size in each school. This differs from the pupil/teacher ratio, in that it is based on actual classes being taught, rather than simply the total number of pupils and teachers in the school.
Discover how many boys and girls there are in each year; handy for spotting bulge years, increasing school size and single sex schools which have mixed sixth forms.
Explore the diversity of pupil backgrounds.
Approximately 15% of pupils in the UK have a Special Educational Need (SEN) of some kind and many parents have told us it can be very challenging to find out what SEN provision is available in which schools; which is why we introduced our new SEN tab and SEN school filters, which simplify the process of finding schools with specialist SEN provision.
Find out what SEN provision a schools has, e.g. whether it has a SEN unit and what the current number of pupils under the SEN provision are, along with the total capacity for the provision.
Discover what types of SEN the school specialises in, such as ASD etc.
You can filter the schools displayed on the map based on their SEN provision allowing you to quickly and easily identify suitable schools for your child.
Our school workforce tab allows you to drill down into the number of classroom teachers, teaching assistants, support staff and other school workforce members; as well as being able to see how the numbers of each type have changed over recent years.
See how the pupil teacher ratio has changed over time, including the ratio of pupils to both teachers and teaching assistants.
See how the total number of pupils has changed over time; e.g. is the pupil population growing or shrinking.
Explore the amount of different staff types at the school, such as teachers, senior leaders, teaching assistants and non-classroom support staff.
As well as over 30,000 schools we are also show over 28,000 nurseries and childcare providers in England.
We show the headline items from each nursery's latest Ofsted inspection including its summary findings, so you don't have to open and read the individual reports for each nursery. The providers full inspection history is also available at a glance.
We show all childcare providers that are registered with Ofsted and not on domestic premises.
Discover what students do after leaving each school, with our detailed leaver statistics, sourced from the Department for Education.
After their GCSEs, find out if pupils remain in education, and if so where, or whether they move on to employment or perhaps an apprenticeship.
After their A-Levels, discover how many pupils remain in education or move on to employment. For those that continue on to higher education, see how many attend top universities such as the Russell Group or Oxbridge (Oxford or Cambridge).
We display headline financial information for each school, which provides an interesting insight into its funding, expenditure and budgeting.
Total, grant and self-generated income shows where pupil funding comes from and how much it is.
Total, staff and property expenditure show spending across key areas.
In year balances show if the school is over or under spending, whilst revenue reserve shows what savings are available.
Add schools to your shortlists. You can then choose to view only your shortlisted items on the map and even compare schools side by side.
Compare your shortlisted schools side by side.
Save your shortlists or share them with friends using our simple URLS.
As well as all state primary and secondary schools, we also show all independent schools in the UK, including preps (preparatory schools). GCSE information from the school, not available from the Department of Education exams website, is also displayed where available.
Independent schools are often inspected by the Independent Schools Inspectorate. We include links to all ISI reports, as well as inspections from all the other main inspection bodies. We also show highlights from ISI inspections.
Options for boarding are shown on the summary tab.
School fees can also be found on the summary tab.
As well as schools and points of interest, you can also find on Locrating public transport options to help you assess the suitability of an area for you transport needs.
Map markers indicate the location of many thousands of railway stations and other forms of public transport; including underground stations, tram stops, metro and light railway stations. Our data covers the whole of Great Britain.
Plan a journey from a marker to anywhere else you like, or view the station's network map by clicking the link in the popup.

Often when researching school catchments people need to know how far they are ‘as the crow flies’ from a school. Our distance calculator tool makes such a measurement easy to do.
Simply right click on the map (or on a touch device press and hold) and a pin will appear to mark your "Home Location", you can drag the pin around or click elsewhere on the map to move it. Place this pin where you live (or intend to live) then if you hover over a school or other marker it will measure the distance between the two.
To streamline our user support, we have a fully featured helpdesk. You can use this to provide feedback, make suggestions, report bugs or for any other questions you might have. We're available 7 days a week, 365 days a year to answer member's questions.
You can access the helpdesk via your profile page, where you will find a Helpdesk menu option. We aim to answer all tickets within a few hours, however outside of Mon-Fri, 9am-6pm, this may take a little longer.
Click here to raise a new ticket.
We continually add new innovative features to help you make the most informed decisions possible.